.jpg)
SaaS Application Development Services in USA
Need a SaaS app developer?
Please complete this form and we’ll follow up within one business day.

Top SaaS Application Development Company
Clutch, an independent research firm that ranks development companies based on their ability to deliver, ranked CognitiveClouds as a Top SaaS Application Development Company.


Assessing your options for custom SaaS application development?
Looking to expand your business and operational reach? A custom SaaS development services from CognitiveClouds will put you front and center in today’s distribution model so you can quickly scale your sales growth.
Don’t Get Shut Out of the Market
75% of the total cloud workloads have taken the form of SaaS, according to the Cisco Annual Internet Report. Established enterprise behemoths and startups alike are building cloud-based SaaS platforms for every business role and industry vertical. Whether you’re building a new SaaS application from the ground up or migrating your on-premise architecture to a SaaS architecture, you’ll save on cloud infrastructure and maintenance costs with your custom SaaS platform. You’ll also see productivity improvements from your SaaS development team who will be able to roll out new features to all of your customers faster.

Shifting to SaaS Platform Development Creates New Opportunities
The shift in software distribution has changed the way both businesses and consumers view software. Consumers today look for flexibility, convenience, security, and usability – and the advantages of SaaS applications and platforms in all these areas are unmistakable.
Plus, for the SaaS business owner, scalability and predictable revenue spurs the growth of your business. You’ll enjoy a boost in sales while offering a highly-optimized SaaS product that your customers will love.
Companies That Chose Our SaaS Application Development Services


Case Studies: Real-World Applications of Our SaaS Development Services
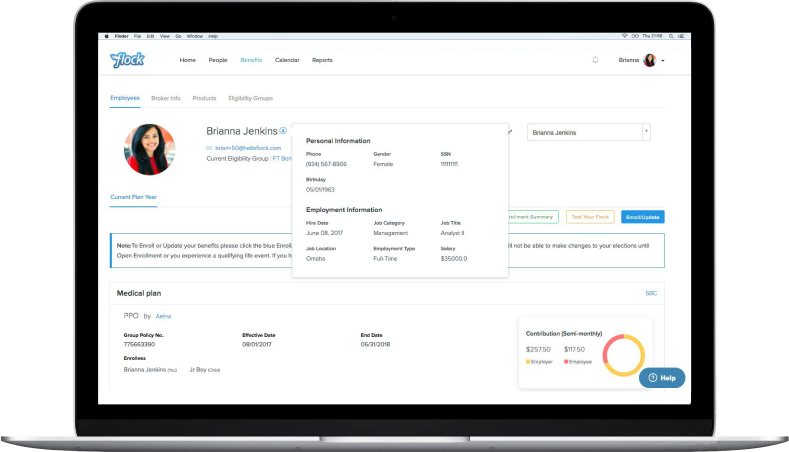
Human Resources
Custom SaaS Application Development for HRMS Company
The founders of a SaaS company came to us with an idea and some rough written requirements for an HRMS (Human Resource Management Software) system. Our UX designers created mockups for their 78-screen responsive custom SaaS application, and our SaaS developers delivered the first-version product within 4-months. The MVP we built helped the founders raise seed funding and they retained members of our SaaS development team for 18 months to build out features on their SaaS product roadmap. This HRMS startup recently was acquired by Paychex.

Sourcing and Procurement
First-version SaaS App Development for Automation Company
Manufacturers source parts from many suppliers and large manufacturers have teams dedicated to obtaining the best price for each part. The founders of PartAnalytics tasked our expert team to design their end-to-end SaaS application that automates manual research, data entry, and cost savings calculations. Over 4+ years, our team was a reliable partner to PartAnalytics, helping them create an MVP, first-version product, and many other major and minor feature additions. The SaaS application we developed enabled PartAnalytics to raise multiple rounds of funding and close deals with Fortune 500 companies.
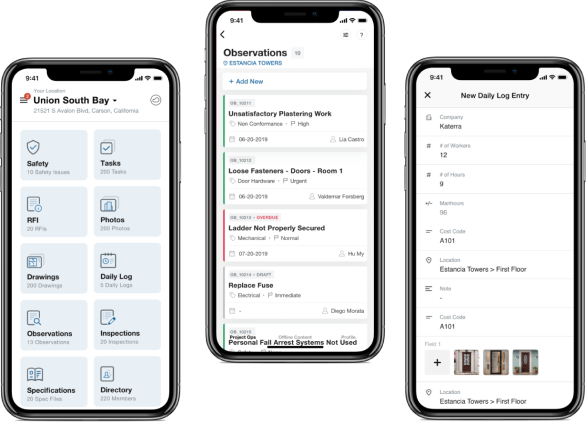
Construction
Strategic SaaS Software Development for Construction Company
Backed by the Softbank Vision Fund, Katerra raised over $1.6B to disrupt the construction industry by investing more than 1% of its annual budget (the industry average) in technology to improve operational efficiencies. Katerra tasked CognitiveClouds with building a custom mobile-first SaaS construction management application to compete with ProCore, the market leader in project management solutions for the construction industry. Our team of 16 UX designers and SaaS developers built Katerra’s first-version SaaS application and iterated on the product over 20 weeks.

Automotive
Unified SaaS App Development for Automotive Company
An electric vehicle (EV) manufacturer with a connected car fleet designed to bring the “Future of Mobility” to the world lacked the development skills to create a unified SaaS platform to leverage each vehicle’s data-sharing capabilities. The automotive company retained our in-house team to create a scalable cloud database to fetch and store data from the fleet of connected vehicles. Our team also designed and developed companion enterprise web and mobile applications for fleet management, car-sharing, ride-hailing, and more. For 29 months, our developers crafted a complex SaaS application for this innovative automotive company.

Events
Modern SaaS Platform Development for Virtual Events Company
Before COVID, most virtual event platforms were clunky and cumbersome to use. Even Zoom-based conferences left a lot to be desired. Kyte selected CognitiveClouds to create a modern web-based virtual events SaaS platform for hosting everything from small networking events to full-scale virtual conferences. Using an intuitive UI, conference organizers author and publish free and paid virtual events, which they promote via their email lists and marketing channels. Kyte’s SaaS-based application gained some early traction with event and conference organizers.

Healthcare
HIPAA Compliant SaaS Application Development for Telemedicine Company
With the onset of the coronavirus pandemic, virtual medical consultations and therapy sessions became the safest and sometimes the only way to provide healthcare services. Nova Telehealth selected our SaaS development company to create a secure, HIPAA-compliant, patient-centric web application to facilitate telemedicine consultations via web and mobile devices. Patients simply click on a URL and enter their doctor’s virtual waiting room without the need to download an app or create an account. Nova Telehealth successfully launched its SaaS product and is growing its market share with hospitals and clinics.

Get Ready to Transform Your Software Business with our Custom SaaS Solutions
A world-class SaaS product will transform your business. Are you ready to develop a Software as a Service solution? An investment in CognitiveClouds’ SaaS development services is an investment in the future. As well, updating your existing product to a SaaS platform offering and monetizing it through a subscription model allows you to open your product up to SMBs that couldn’t previously afford a specialized software solution.
Large projects or small, at CognitiveClouds we have a proven track record of helping startups attract funding and enterprises turbocharge their sales.
Why SaaS Application Development is Critical in Today’s Business Environment?
In the past few years, we’ve seen how nearly all software market segments are being driven by the shift towards SaaS solutions implementation, and our experienced SaaS development company has helped a considerable number of companies in USA make the transition.

Improved Security
IT departments understand that SaaS products typically incorporate industry-leading encryption and can be as secure or even more secure than software hosted on-premise

Cost
SaaS software is deployed in the cloud, meaning additional hardware or IT architecture upgrades aren’t always needed. Plus, you’ll save the costs associated with resources needed to deploy, patch, and maintain applications

Scalability
The flexibility offered by cloud based applications gives you a level of scalability that locally-hosted apps simply can’t match. New versions with expanded functionality can be deployed easily, without the need to spend time upgrading to the latest version

Integration
Because the apps are run on a cloud computing platform, they’ll integrate easily with your existing SaaS solutions, technology or platforms like Mulesoft and SnapLogic
Deploying your customized SaaS application not only lowers distribution costs, but reduces acquisition, maintenance, and hardware costs for your customers as well – in addition to the peace of mind that comes with enhanced security.
Our SaaS Application Development Process
Each SaaS application development project begins with a concept. However, fundamental questions have to be answered first.
Who does it serve? What problem does it solve? To help refine your idea, we will work with you to conduct a discovery session that results in a detailed list of specifications.
After the discovery phase, we’ll get to work designing the end-to-end product. For our SaaS application development services, CognitiveClouds uses what's called "design-driven development" to create the entire end-to-end product. Using Figma, a leading cloud-based design tool, our UX designers will create every core screen, ancillary screen, and modal. The design completion point will see about 95-98% of user interactions designed, and the final design will serve as a visual spec or a blueprint, which our SaaS app development team uses to complete the architecture and estimate the development timeline. Finally, we will create a clickable prototype in Figma, which allows for user testing and all stakeholders to be aligned on the user flows within the app.
What our SaaS Application Development Services Plans Include?

The SaaS software package
This is the actual product that will be deployed to your customers, built from the ground up to handle your specific needs. The final SaaS product will be thoroughly tested, optimized, and monitored for any operational issues before delivering the source code via GitHub.

Sales Platform and Front-end Informational Site
While often overlooked, the front-end website used to market and sell the software is a crucial part of any SaaS platform. To make sure the marketing site has the right impact, our experts will ensure that it contains the right targeted content designed to capture leads and convert them into sales.

Subscription Suite and Account Management
Ultimately, you’ll need an account management system to sign up the new users and process payment securely. Our SaaS development company will provide the necessary multi tenant architecture and user management tools to ensure your SaaS product is a success, with a role-based system allowing users to edit and update account information, track sales, handle customer service, and more.
Leading US SaaS Development Services Company
With a proven track record of helping startups and large companies alike build customized web, mobile, and tablet products, our SaaS development company will take your idea through to completion quickly and affordably.
Technology Stack
With a proven track record of assisting both startups and large enterprises, our SaaS development company specializes in creating customized web, mobile, and tablet products. Our approach combines a variety of advanced technologies to deliver robust and scalable applications.
Ruby on Rails: Efficient Application Development
Our team harnesses Ruby on Rails for its efficiency and reliability. This robust framework enables us to build high-quality applications that are both scalable and maintainable, ideal for a variety of business needs.
Python: Versatility in Application Development
Python stands as a cornerstone in our development process. Known for its versatility, it's suitable for a wide range of applications, from simple scripts to complex machine learning algorithms, making it a versatile tool in our arsenal.
Node.js: Real-Time, Scalable Solutions
For applications requiring real-time processing and scalability, we leverage the power of Node.js. This technology is ideal for creating fast and efficient network applications that can handle concurrent requests with ease.
AngularJS: Dynamic Front-End Development
In front-end development, AngularJS is our preferred framework. It enables us to create dynamic, responsive SaaS applications that offer a seamless user experience across all devices.
iOS & Android: Comprehensive Mobile App Development
Our proficiency in mobile application development encompasses both iOS and Android platforms. We focus on creating intuitive, user-friendly, and high-performing mobile applications, ensuring your product appeals to a broad audience.
Spree Commerce: Customizable E-Commerce Solutions
Our expertise in Spree Commerce allows us to build comprehensive, customizable e-commerce solutions. This platform is particularly beneficial for businesses aiming to establish or enhance their online retail presence.
Security Measures
Robust Encryption
Our SaaS apps are fortified with advanced encryption protocols to enhance the integrity and confidentiality of your data against unauthorized access and breaches.
Comprehensive Data Protection
We prioritize data protection by implementing stringent security policies and compliance standards. This approach safeguards sensitive information and maintains trust and reliability in our SaaS solutions.
Secure User Experience
Every user interaction within our SaaS applications is secured with the latest security measures. We provide a safe, reliable, and seamless experience that builds user confidence and loyalty.
Scalability and Performance Optimization
Nowadays, scalability and performance are key to the success of any mobile application. At CognitiveClouds, we design our SaaS mobile applications with these critical factors at the forefront. Our approach ensures that as your user base grows, your application scales seamlessly to meet the demand.
We employ state-of-the-art techniques to guarantee that our applications can handle increased loads without compromising on speed or responsiveness.
Load balancing, efficient database indexing, and optimized caching strategies are integral parts of our development process. These techniques ensure that your application remains fast and responsive, even under heavy user traffic.
Our team continuously monitors and fine-tunes the performance, making sure that your application is not just meeting but exceeding expectations. With our focus on scalability and performance optimization, we ensure that your application is ready for today and prepared for tomorrow’s growth.
Benefits of Our SaaS Application Development Services Company
- Complete end-to-end design and SaaS development services
- Our SaaS applications offer outstanding UX and design aesthetics
- We use a wide array of technologies including iOS, Android, Ruby on Rails, Goland, Scala, Node.js, and AngularJS to create modern, responsive SaaS products
- Our SaaS development company follows design-driven development principles to accelerate delivery and provide a robust application solution
Get Your Software Product to Market Quickly and Affordably With CognitiveClouds
Whether you’re a large enterprise or a small startup, getting your own custom SaaS product into the marketplace has never been easier. Get in touch with us today to discover how we can turn your idea into a profitable reality.